The Complete Guide to Using Spotify for Artists
Discover the full marketing potential of your music with complete control over your Spotify artist profile and loads of promotional tools.
Spotify for Artists is your home as an artist on one of the world’s most iconic streaming services. From the moment your first track reaches Spotify, you gain access to a wealth of tools for customisation, promotion, and tracking.
Spotify for Artists will help you to get to know your audience. Use this information to reach fans on an even deeper level and power up your music career. You’ll also discover new revenue streams and discover ways to connect fans with your concerts, merchandise and more.
Use the table of contents below to find exactly what you’re looking for, or simply scroll down to find out all about how Spotify for Artists is going to expand your journey as an artist.
- Upload your music to Spotify
- Get your streaming analytics in real-time
- Understanding your audience with analytics
- Craft your artist profile
- How to customize your artist profile
- Accurate and comprehensive information
- Pitch your songs to Spotify playlists
- Get the Verified badge
- Upload Spotify Canvas artworks
- Add lyrics to your songs
- Add your Spotify Artist Pick
- Sell your artist merch
- Promote your concerts
- Spotify Marquee promotion
- Spotify Showcase promotion
- Upload Spotify Clips
- Linking social media accounts
- Leverage social media for promotion
- Encourage fans to engage
- Final tips for promotion
- Add team members to your Spotify for Artists
- Spotify Wrapped for artists
- Stay up to date
- FAQs
Publish your music on Spotify and embark on your music career
First of all, you’ll need to get your music on Spotify. Thankfully, there’s a free and easy solution for you. At RouteNote we offer free, unlimited music distribution to Spotify as well as many more streaming platforms, music stores, and social apps.
Why should I choose RouteNote for distributing music?
You can upload unlimited singles, EPs, and albums of any size through RouteNote. Choose any of our partners including all the top music services around the world. Customise the exact territories where you’d like your music to be made available, or leave them as they are for a global reach!
You can upload your music to RouteNote at no charge. You keep 85% of all the revenue your music generates across all stores. Choose to upgrade to Premium at any time and keep 100% of your revenues for a small upfront cost.
Once your first release has arrived at Spotify, we’ll help you to get set up with a Spotify for Artists account in no time. Even if you’re release isn’t live yet, if it’s arrived at Spotify with a future release date we can get you access before release day.
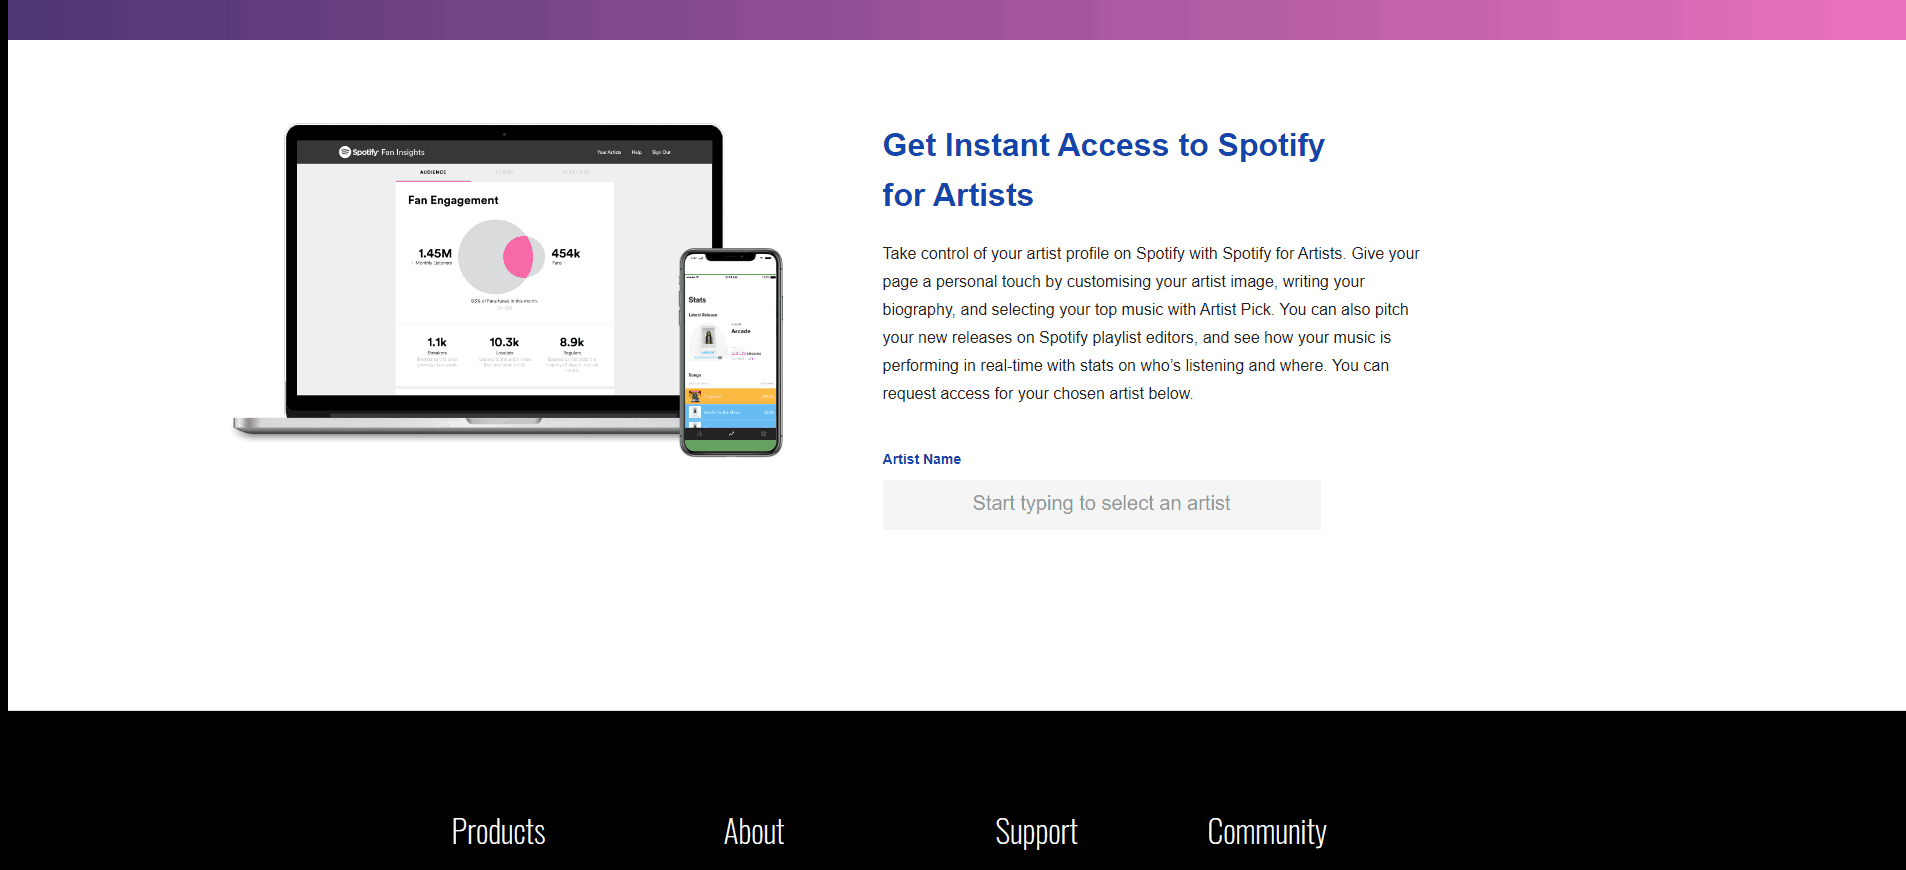
Here’s how to claim your Spotify for Artists profile:
- Log into your RouteNote account
- Head to the Artist Services tab
- Select Spotify for Artists
- Fill in your details to gain instant access to Spotify for Artists for your Spotify artist page
Alternatively, just click here.
Now you’re set up and ready to start exploring. There’s so much you can do on your Spotify for Artists hub. Read on to explore how you can take your artist profile to the next level, track your statistics in-depth, and interact with fans.
Unleash the power of analytics: Decipher your Spotify performance and discover insights
Spotify for Artists offers you real-time analytics that you can dive deep inside to discover your audience and exactly how well your music is doing.
You can access your statistics through Spotify’s artist platform on desktop or from their mobile app. They’ve even recently updated their app to give you even more data on the go.
On your home page you will be presented with an overview of your performance. Straight away, you can see how many people are listening to your music right now!
You can switch language on your Spotify for Artists if you’d rather see your hub in your native language or otherwise.
From the column on the right you can see how many listeners you’ve had, how many times your music has been streamed, and your follower count in the last 7 days.
Just below you can view your tops songs by streams and the playlists you’re having the most influence in.
View in-depth streaming analytics for songs and releases
From the menu on the left you can explore your statistics in much more detail. Head to the Music tab to explore how your individual releases and songs are doing.
Here you can set filters to choose a specific time range that you want to see stats for. This presents an overall view of all your releases in this time frame.
You can click on every song and release to get an even deeper breakdown of that specific track, EP, or album. It will show all-time streams updated live, saves, playlist adds and so much more.
From the Playlists tab you can view the playlists you’ve been added to and the number of streams you’ve earned from there.
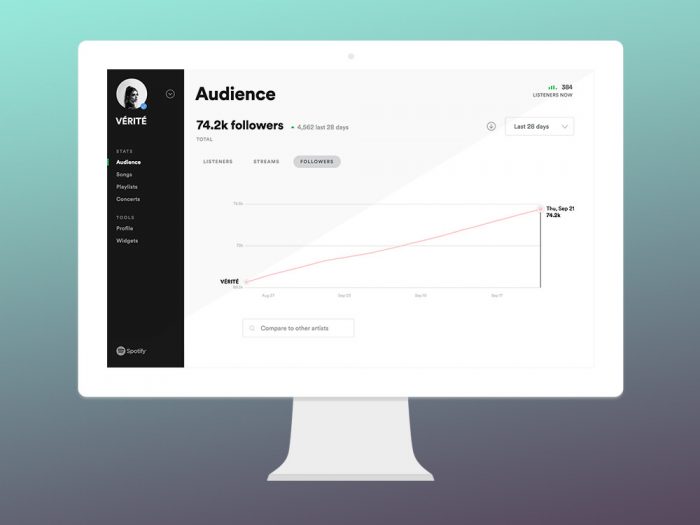
Find your audience on Spotify
Head to the Audience tab on the left-hand side of your Spotify for Artists hub to find out who your listeners are. This page is split into sections that allows you to discover who loves your music.
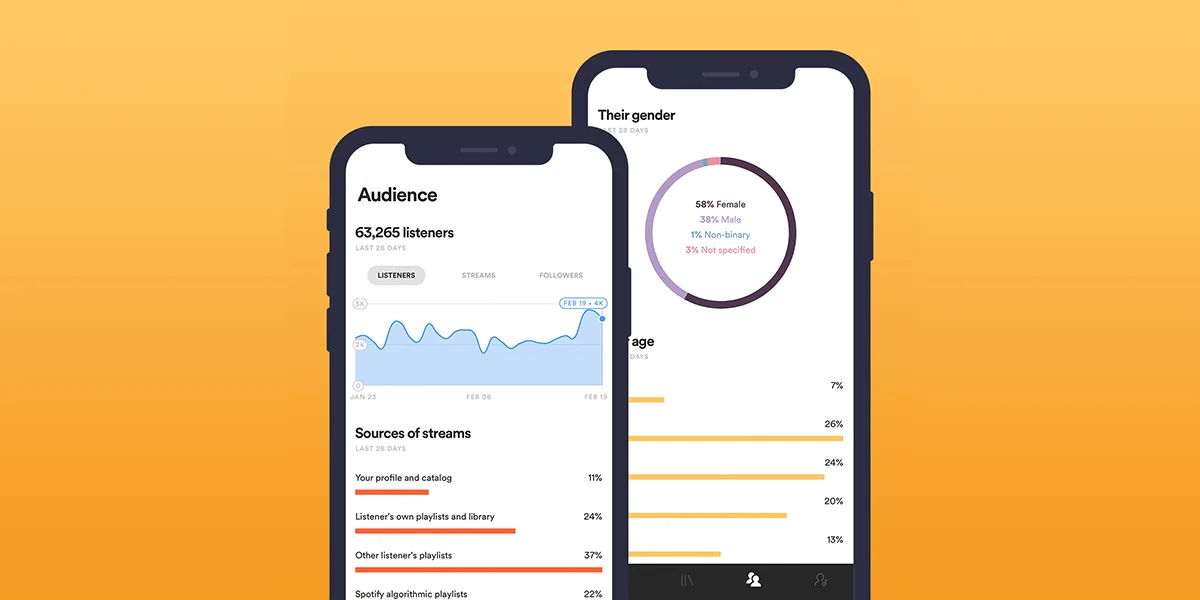
Under Demographics you can find out the type of people your music appeals to, by age and gender. Then over on the Location tab you discover where in the world people are listening to you the most, even down to the cities you’re most popular in.
A recent update lets you take a super quick look at how people are engaging with your music. The new Audience Segmentation feature gives you a snapshot of whether your audience are engaging right now or if they’ve dropped off.
In a similar vein, Active Audience helps you to find out who your superfans are and who’s listening to your music as a casual fan.
See how your latest Spotify release is engaging with fans
Spotify recently launched a new section to your Audience page. Release engagement allows you to look at exactly how your most recent releases are playing with your fans.
You can explore your releases released in the last month to explore their level of engagement.
This section shows the direct number of your followers who are listening to your most recent releases. So if only a small percentage of your followers are tuning into your recent release then you know you need to engage with them more.
Spotify helpfully link to some ways you can promote your release to fans and build your numbers. We’ll get to them in this article shortly.
Want to find more about how audiences discover music and how you can boost your own music? Check out Spotify’s Made to Be Found site, exploring how artists can get found on one of the world’s biggest platforms.
How can analytics help you understand your audience on Spotify?
Analytics offer a treasure trove of insights that illuminate who your listeners are and how they engage with your music. These tools reveal crucial details such as the demographics of your audience, their geographic locations, and the pathways through which they discover your songs.
By analyzing this data, you can craft more effective promotional strategies, pinpointing exactly where to direct your marketing efforts. For instance, if you notice a surge in listeners from a specific region, you might consider focusing promotions there or even planning live performances.
Understanding listener demographics—such as age, gender, and musical preferences—empowers you to tailor your content to better resonate with their tastes. This tailored approach not only deepens engagement but also helps expand your fan base by delivering precisely what your audience desires.
Ultimately, leveraging analytics allows you to make informed decisions that enhance your connection with listeners and optimize your growth in the music world.
Crafting your artist profile: key information to include
When building your artist profile, you want to ensure it’s packed with information that represents you and your music effectively. Here’s what you should include to create a compelling profile:
Artist name and biography
- Artist name: Ensure your artist name is clear and easy to search.
- Biography: Write a succinct yet engaging biography that captures your musical journey, influences, and style. Highlight milestones or unique stories that set you apart.
Genre and musical style
Clearly define your genre and musical style. This helps listeners and potential collaborators understand what to expect from your music and makes it easier for fans of similar genres to discover you.
Links to your online presence
- Social media accounts: Add links to your active social media profiles where fans can keep up with your latest updates.
- Official website: If you have a website, include it to give listeners a more in-depth look at your work, including merchandise and tour dates.
Current photos and visuals
Update your profile with recent photos that visually represent your brand and style. A professional image can make a strong first impression.
Latest releases and upcoming projects
Regularly update your profile with information about new releases, whether singles, albums, or collaborations. This keeps your profile dynamic and your audience engaged.
Tour dates and event information
Share upcoming tour dates and events. Not only does this inform fans, but it also can attract new listeners who might want to catch a live show.
Maintain accuracy and relevance
Keeping all these details up-to-date ensures that anyone who visits your profile gets an accurate glimpse into your musical identity. Regular updates with fresh content will keep your profile engaging and professional.
Craft an attention-grabbing Spotify artist profile: A step-by-step guide to customization
With access to your Spotify for Artists hub you can make your profile shine with personality. From the top left of your page, select View profile and then click the pencil icon in the top right to take control.
Here you can add a Header image that appears at the top of your artist page. Similarly you can choose your Avatar image to change your main picture. Be sure to pick something iconic, that immediately says “this is who I am as an artist”. These images will appear to all listeners old and new who visit your profile on Spotify.
Image guidelines on Spotify for Artists:
- File format: jpeg, gif, or png.
- Avatar images must be at least 750x750px.
- Header images must be at least 2660x1140px.
- Avoid text, logos, and busy backgrounds.
- Get more tips on Spotify’s FAQs.
On your profile page, select the About slide to bring even more personality to your profile. Add more images into a gallery that viewers can slide through to get a taste of who you and your music are.
Select the pencil next to Bio to write your biography. Make it unique and personal, it’s your chance to tell people what you’re all about whilst imbuing your personality at the same time.
Select More Info to add links to your social media, website and more. This offers fans a direct channel to find out more, follow your pages, and head to your website to find merch, tour dates, and any of your other endeavours.
Why is it important to have accurate and comprehensive details in your artist profile?
Crafting an accurate and detailed artist profile is vital for making a lasting impression in the digital music world. An effectively filled-out profile does more than just showcase your talent; it enhances your professional appearance, helping you stand out in a crowded marketplace.
Boost discoverability
Having a thorough artist profile increases your visibility, making it easier for potential listeners to discover your music. With complete information, you are more likely to appear in relevant searches and recommendations, thus expanding your audience base.
Engage and connect with fans
A well-crafted profile not only attracts new listeners but also fosters a deeper connection with your existing fans. By providing up-to-date information about new releases, photos, and tour dates, your profile serves as a go-to hub for fans to stay informed about your latest activities.
Reflect your brand and music accurately
An artist profile is an extension of your brand. Consistently updating it ensures that your profile accurately reflects your image and music style. This alignment is crucial for maintaining authenticity and ensuring that anyone who discovers your music fully understands your artistic identity.
Regularly revisiting and refreshing your profile keeps your content relevant and can significantly impact how both fans and industry professionals perceive you. Whether you’re an emerging artist or an established name, a detailed artist profile is a powerful tool in your music marketing strategy.
Elevate your music by pitching to Spotify playlists and gaining wider exposure
Getting your tracks on Spotify’s editorial playlists is one of the best ways to spread your music. It gets you heard by potentially millions of new listeners, on hot, trusted playlists.
To pitch your songs to Spotify’s playlists you will need to have uploaded a track that hasn’t gone live to listeners yet. The sooner you pitch to Spotify before your track releases, the better your chances. We recommend uploading through RouteNote far enough in advance that it arrives on Spotify a month before release, if you want to pitch to Spotify.
Once your music has arrived on Spotify you’ll be able to find it in your Spotify for Artists profile. At the top of your Home page, select PITCH FROM NEXT RELEASE, select your song, and then fill out your details. You can also pitch from your Music tab on your Spotify for Artists page.
Spotify recommend providing as much info as possible in your pitch to help their curators. We’ve heard mixed results as to whether the info matters all that much.
Once you’ve pitched your song, Spotify curators will check it out and if they like it they’ll include it one or more of their top playlists.
Gain the verified badge and enhance your artist credibility
Getting verified on Spotify shows you’re legit with a lovely blue tick. It ensures that all listeners know they’ve found the real-deal when they see your artist profile.
To get your verified blue tick on Spotify, you simply need to claim your Spotify for Artists account.
If you’ve made it this far in the article. then you should already have it! If not, head to the top of this page to find out how to get access to your Spotify for Artists account and all the treasures it holds.
Embrace visual flair: Elevate your songs with an engaging Spotify Canvas
Spotify Canvas is a great way to bring your music to life. It adds an animated artwork to your release that loops when listeners are playing your music.
It brings your music to life, adds personality to your music, and offers fans a deeper dive inside your world. Use your unique aesthetic as an artist or emphasise the visuals you created for a track in it’s promo and music video.
Add Canvas to your songs from the Music section. Click on the song you want to add moving artwork to and select ‘Add Canvas‘ from the top right. On mobile, head to your track page and select ‘Create Canvas‘.
You can add any kind of video content; animations, live-action, montages, and more!
These are the specs and guidelines for videos on Spotify Canvas:
- Your video needs to be in 9:16 vertical ratio as it fills the screen vertically.
- It must be at least 720px
- Videos need to be 3 – 8 seconds long
- MP4 or JPG formats only
- Adhere to Spotify guidelines
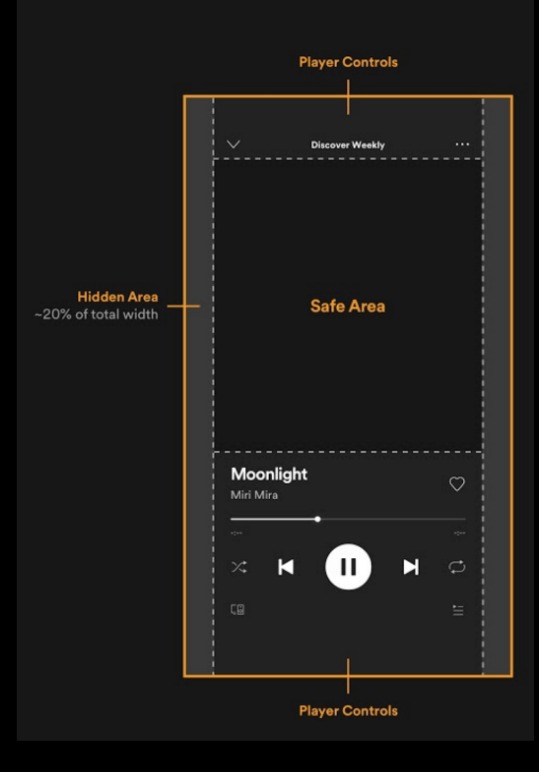
Also consider a potential blind spot for your video on taller phones.
You can see here how your Canvas might lose its edges on phones like the iPhone X and Samsung S9.
Anything inside the safe area will be visible to all listeners, filling their screen.
The hidden area will be lost on taller phones so consider whether your video loses any crucial visuals on its edges.
View more info on creating the perfect Spotify Canvas video here.
Ignite lyrics engagement: Add, edit, and enhance your music with lyrics
Add your lyrics to Spotify so that fans can sing along and see exactly what you were pouring your heart out over in your verses.
Unfortunately, you can’t add lyrics directly through Spotify for Artists. Thankfully, it’s still reasonably easy to add lyrics to your songs across Spotify.
Spotify are partnered with Musixmatch. Through their platform you can add, edit, and sync your lyrics, add credits, and translate your lyrics.
You will need to join Musixmatch Pro to claim your artist profile and add lyrics to Spotify. Once you’re in, you can add your lyrics and they’ll be added to your Spotify tracks within hours, as well as other streaming services like Apple Music, Amazon Music, and Instagram.
Find out more and sign up to Musixmatch Pro here.
Highlight your top releases: Feature your artist pick and steer fans towards your favorites
Your Artist Pick is your chance to highlight something special to everyone who visits your artist profile. It might be your new release, a playlist compiling your essential hits, or even tickets to your tour dates and new merch.
Your Artist Pick shows at the top of your Artist Profile on Spotify, so you can place whatever you want to promote centre stage to visiting fans and new listeners alike.

To set your Artist Pick on Spotify, head to your profile. Click Add next to Artist Pick, select what you want to promote, and then click Done. You can also add a message and a photo to your pick for a custom touch.
Amplify your brand: Showcase your artist merch and connect with fans
Fans who love your music, enjoy showing that they love it. Branded shirts, logos on totes, caps with your name on it – there is endless possibility for merchandise. It promotes you, builds connections with fans, and earns you cash as well.
Adding merch to your Spotify page allows fans to immediately connect with your brand and invest in your products. It means that when an artist falls in love with your music and is browsing your page, they can explore what merch you offer right there.
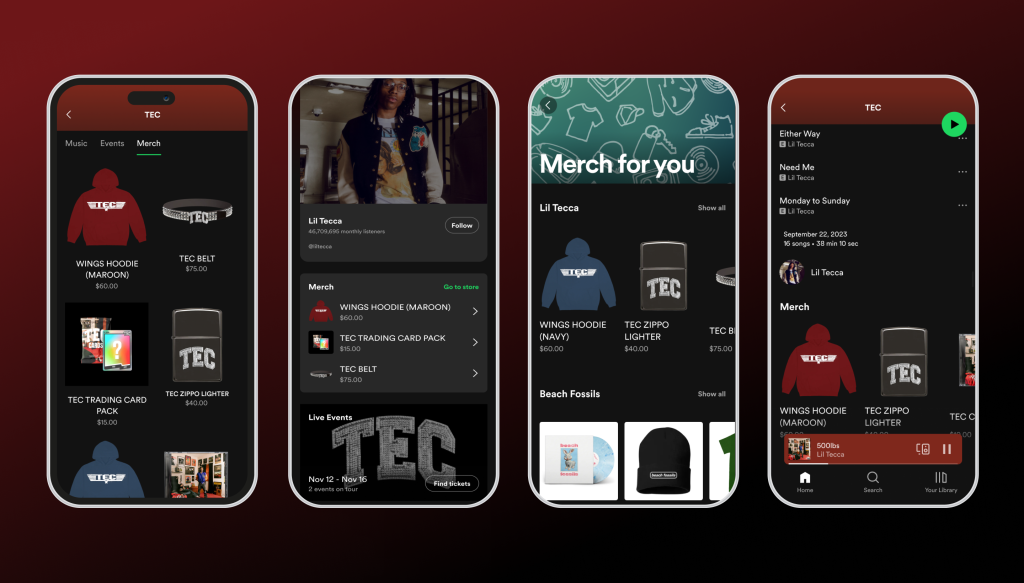
Image credit: Spotify
To present your merch on your artist page, you will need to have a Shopify store and to link it to your artist profile. Once connected, you can publish up to 250 merch items from Shopify to Spotify for Artists. Once connected, you can manage what you present on your page and how it appears.
Spotify have begun boosting merch even more to increase your sales. They found that fans were buying merch more than ever during last year’s Spotify Wrapped. So this year, they’re promoting merch in special ways to superfans with discount offers to promote even more merch sales.
Spotify have also updated their mobile app to introduce a Merch hub where fans can explore all the products on offer from their favourite artists. They have also created a unique tab for merch on artist profiles so that listeners don’t have to scroll down to find an artist’s offerings. Now, they can click straight through to it.
Add merch to your Spotify artist page by getting a Shopify profile now.
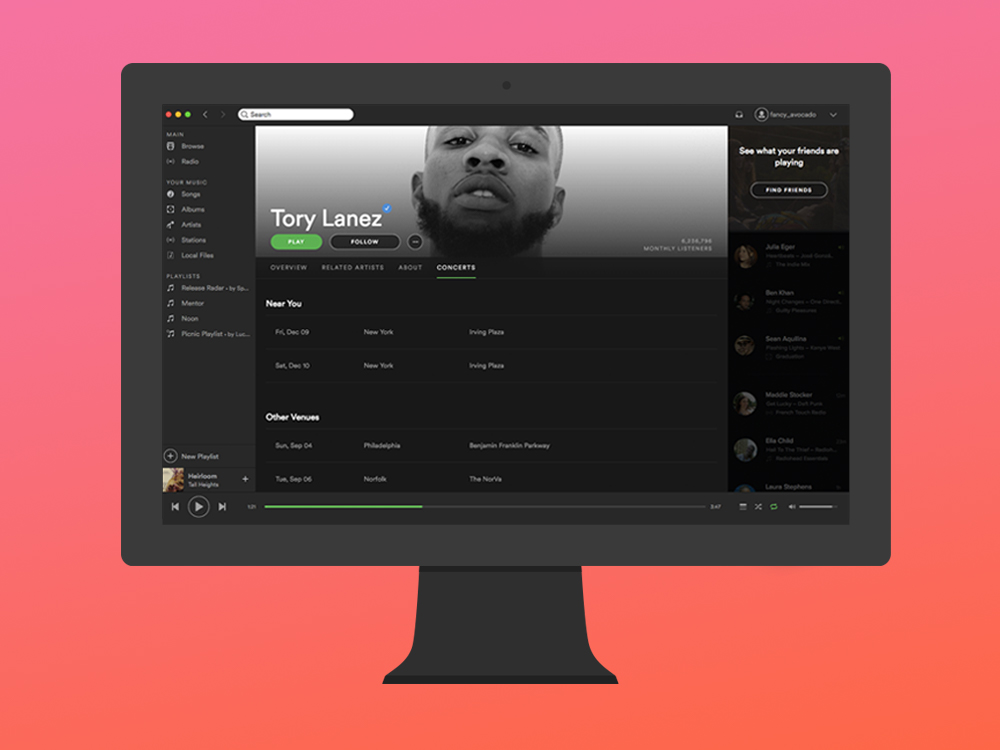
Unleash your tour prowess: Integrate your upcoming concerts into your Spotify profile
Adding your upcoming concerts to Spotify is a fantastic way to connect with fans and boost ticket sales. It allows listeners to immediately see if you have gigs in their area and quickly click through to buy tickets.
To add your concerts to your artist page on Spotify, you’ll need to list them on one of Spotify’s ticketing partners:
- AXS
- Bandsintown
- DICE
- Eventbrite
- Gigantic
- NoCap
- nugs.net
- Resident Advisor
- See Tickets
- StageIt
- Ticketek
- Ticketmaster
- Tixr
- Eplus (Japan only)
The concert listing needs to include:
- At least 1 artist name
- Start time
- Venue name
- Event name
Spotify will also send email recommendations to your fans when you add upcoming concerts relevant to their location.
Use Spotify for Artists demographic data to discover exactly where your biggest fans are. Use that to inform where you pick your tour dates and reach the most fans, ensuring ticket sales.
Command attention with Spotify Marquee: Promote your music to a wider audience
Give your new releases the attention they deserve using Spotify Marquee. This campaign feature promotes your new release to listeners as they open the app.
Marquee is a powerful, full-screen recommendation to listeners that Spotify thinks are the right audience for your music. This encourages them to check it out and stream your new releases, putting your new music in front of the listeners who matter instead of relying on random discovery.
You can create a Marquee campaign in your Spotify for Artists dashboard on desktop. It is available in the US, UK, Australia, and Canada. Marquee is a paid-for promotion of your music.
Not everyone has access to Marquee, sadly. Spotify promise that they are working to expand access to more artist teams.
Spotlight your new releases with Spotify Showcase: Capture listener attention
Showcase is a relatively recent feature for promotion on Spotify. It lets you push a release to the top of the home screen on listeners’ apps.
Interestingly, Spotify found that 75% of first-year streams happen over a month after release. Showcase is a great way to push your release again after it’s had its initial push at launch.
Spotify state that listeners are 6x more likely to click on a Showcase promoted release. You can customize the audience that you want to promote your Showcase, based on the type of listener you want to reach.
Spotify Showcase is a paid promotion that you can access from your Spotify for Artists portal. Showcase is available to eligible artists only, so you may not have access to the feature just yet.
Engage your fans with Spotify Clips: Share stories, announcements, and behind-the-scenes footage
Connect directly with fans by creating a video clip that sends a message to your audience. Spotify Clips let you talk directly to your listeners, sharing your story, creative process, talking about your new release, or anything you like really!
Clips help to drive interactions and therefore build streams on your songs, favourites of your content, and follows on your artist profile.
To add a Spotify Clip, open the Video beta tab on desktop or tap the Clips card on the Spotify for Artists app home page. Upload a video less than 30 seconds. You can add your caption and even tag one of your releases to the Clip.
How linking social media accounts enhances your discoverability on Spotify
Connecting your social media profiles to your Spotify artist account can significantly boost your discoverability. Here’s how:
- Seamless fan engagement: By linking accounts, you make it effortless for listeners to follow you on platforms such as Instagram, X, and Facebook. This seamless connection encourages fans to keep up-to-date with your latest releases and news.
- Direct communication: Integrating your social media allows you to communicate directly with your audience. Share updates, behind-the-scenes content, and engage in real-time conversations to strengthen your relationship with listeners.
- Expanding your reach: Each social media platform offers a unique way to attract new fans. By broadcasting your music across multiple channels, you broaden your reach and attract diverse audiences to your Spotify profile.
- Enhanced online presence: A solid online footprint is crucial in today’s digital world. By connecting your accounts, you create a unified brand presence, making it easier for new listeners to discover and recognize you.
- Promotional opportunities: Social media serves as an invaluable tool for promoting your music. When you post links to your Spotify tracks on these platforms, you drive traffic directly to your music, leading to more streams.
Ultimately, integrating your social media with Spotify is a powerful strategy for growing your fan base and ensuring your music reaches a wider audience.
How to leverage social media for music promotion on Spotify
Social media platforms are essential tools for amplifying your music’s reach on Spotify. To effectively use them:
- Share your music: Regularly post links to your Spotify tracks and playlists across platforms such as Instagram, Twitter, and Facebook. This practice not only increases visibility but also encourages sharing among your followers.
- Engage actively: Interaction is key. Respond to comments, ask for feedback, and participate in conversations about your music. This kind of engagement fosters a community around your work and encourages listeners to become fans.
- Utilize hashtags: Employ relevant hashtags to expand the discovery of your posts. This tactic can attract people who are interested in similar music genres, creating new streams of listeners.
- Consistent updates: Keep your audience informed by posting regular updates. Share news about upcoming releases, behind-the-scenes stories, or snippets from live performances. This content keeps your profile dynamic and maintains listener interest.
- Visual content: Use engaging visuals to complement your posts. Eye-catching images or videos can significantly enhance the likelihood of your content being shared, thus broadening your audience.
By effectively using these strategies, you can drive more traffic to your Spotify profile and ultimately increase your streams and listener base. Remember, consistency and authenticity go a long way in building a sustainable online presence.
Why encourage fans to follow and playlist your music on Spotify?
Boosting your visibility on popular music streaming platforms like Spotify is essential for rising artists and established musicians alike. Encouraging fans to follow your artist profile and add your tracks to their playlists can exponentially increase this visibility.
1. Increase your streams and reach a broader audience: When fans add your music to their playlists, it doesn’t just boost your streaming numbers; it also introduces your music to potential new listeners who follow or browse their playlists. This organic expansion is a powerful way to reach audiences you might not otherwise connect with.
2. Strengthen listener engagement: Actively engaging with your listeners by encouraging playlist additions helps build a community around your music. When fans feel involved in your journey, they are more likely to become repeat listeners and loyal supporters who champion your work by sharing it with others.
3. Enhance algorithmic recommendations: Platforms like Spotify use algorithms to recommend music to users. Songs that are frequently playlisted have a higher chance of being recommended by these algorithms, placing your tracks in front of more listeners who match your sound and style.
4. Drive long-term growth: Building a fan base that is not only passively consuming music but actively promoting it helps sustain your growth over time. As fans add your tracks to their personal playlists, your music becomes a staple in their listening routine, fostering a long-term relationship with their ears and hearts.
Encouraging fans to follow and playlist your music is not just about immediate gains. It’s about creating a dynamic ecosystem of engagement that supports and amplifies your artistic journey.
Final tips for successful music promotion on Spotify
To thrive on Spotify, blend various strategies that cater to your unique audience. Engage with your fans through social media to create genuine connections. This engagement can boost awareness and interest in your music.
Email marketing is another powerful tool. Keep your subscribers updated with your latest releases, special events, or behind-the-scenes glimpses. This personal touch can nurture loyal listeners who eagerly support your work.
Don’t overlook the magic of collaborations. Partnering with other artists can introduce your music to new audiences and inspire creativity. Plus, it’s a great way to network within the industry.
Your Spotify profile is your digital storefront—make sure it’s always fresh and appealing. Regular updates keep it relevant and inviting. Dive into analytics to unlock insights about your audience. Use this data to refine your promotional tactics, ensuring they resonate with listeners.
Remember, success is a mix of consistency and creativity. Keep your promotional activities lively and continuous. Over time, these efforts can elevate your visibility and increase your streams.
Empower your team: Grant access to your Spotify for Artists account
There are plenty of people who can help to manage your Spotify profile; your bandmates, label, manager, marketing team, etc. Thankfully, you can give access to your team and even edit their permissions based on what you want them to do.
These are the three levels of access you can give:
- Full Access: These users have complete access to all Spotify for Artists features. They can edit your artist profile, view your stats, and invite new team members. They can also go to the “Team” section to get an overview of everyone with access, change anyone’s access at any time, and view email addresses for everyone on the team. This level might make sense for a band member, or a manager.
- Edit Access: These users can update your profile and see your stats. They can also invite new team members, but only for edit or view-only access—not full access. They can visit the “Team” section to get an overview of everyone who has access, but they can’t see team emails. This level might be right for a booking agent, for example.
- View Access: These users can only view your artist stats, but they can’t change your profile or any of your settings. They don’t have access to the “Team” section of Spotify for Artists either, which means they can’t invite new team members or see the names or email addresses of anyone on the team.
To add your team to your Spotify for Artists, click the arrow next to your name. Under the menu select ‘Manage Team’. You can add email addresses here to invite others to gain access to your Spotify for Artists account with your chosen permissions.
Maximize Spotify Wrapped: Engage with your fans during the year-end celebration
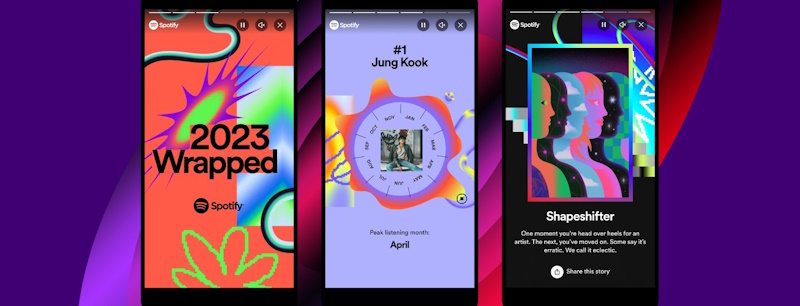
Spotify Wrapped is the music streaming service’s yearly festive fun. It brings together listeners around the globe, sharing in their year’s listening and how their tastes compare.
Spotify have been putting more of an emphasis on how artists can get involved with their fans during this massive annual moment.
In 2023, Spotify allowed artists to upload a video message to their Spotify for Artists which fans could find as part of their Wrapped experience. They also added merch and concert promo to super fans, including merch discounts after finding that merch sales reach their highest during Wrapped week.
These additions give you a great way to connect with your fans when Wrapped rolls around each year in roughly November time.
To view your Spotify Wrapped when it is released this year, simply navigate to your Artist Wrapped card on Spotify for Artists. You will be able to access your Spotify Wrapped there and have the option to share it with your audience.
Keep updated with the latest Spotify for Artists features
We’ve pretty comprehensively covered what you need to know to have an amazing music career on Spotify using Spotify for Artists. There’s still more to discover though, and Spotify are constantly releasing new features.
Keep up to date on their blog artists.spotify.com/blog and on our RouteNote Blog to make sure you don’t miss anything on Spotify for Artists.
Frequently Asked Questions
Answers to the most common questions about Spotify for Artists.
How do I get my Spotify for Artists?
Upload your music to Spotify through RouteNote and then fill out their application form for instant access. Click here to get the Spotify for Artists claim form.
How much does Spotify for Artists cost?
Spotify for Artists is a free platform for artists to use when their music has been added to Spotify. You can upload your music with RouteNote for free, meaning it is entirely free to get your music online and gain access to Spotify for Artists.
Why can’t I access Spotify for Artists?
Once your first release has gone live on Spotify you should be able to claim your Spotify for Artists account within 2 days. If you still can’t claim your profile after 2 days then get in touch with us at support@routenote.com.
How do I get Spotify for Artists before release?
To get access to your Spotify for Artists account before your release goes live, ensure you have uploaded it far enough in advance that it can be added to Spotify with plenty of time before the release date.
Can you make an artist profile on Spotify without music?
You need to have at least one release on Spotify to gain access to Spotify for Artists by claiming your artist profile.
Do I need a Spotify account to get Spotify for Artists?
Yes, you need to have a Spotify account to gain access to Spotify for Artists. If you don’t have a Spotify account, you can sign up for one as you’re gaining access to your artist profile.
What happens if two artists have the same name on Spotify?
There are lots of instances of artists, albums, and tracks having the same name on Spotify. Normally, this doesn’t create an issue. If a release ends up on the wrong page after uploading with RouteNote, get in touch with us at support@routenote.com and we will fix it.
How many listeners do you need to get verified on Spotify?
When you claim your artist profile through Spotify for Artists, your artist page will gain a verified check no matter how many listeners you have.
How long does it take for Spotify to verify if you are an artist?
If you are an artist seeking verification on Spotify, the entire process generally completes within two weeks after your release goes live on the platform. This timeframe allows Spotify to process and recognize your release thoroughly, which is essential for the verification of your artist page.
How do these tools and features help grow your music career?
These tools allow you to better understand your audience, promote your music effectively, and leverage the platform’s features to enhance your career trajectory.
What immediate benefits do you get from setting up a Spotify artist account?
Once your account is set up, you gain access to valuable promotional tools and features that help increase your music’s reach and engagement.
What is a Spotify URI, and why is it important?
A Spotify URI is a unique identifier for your music on Spotify. By claiming your URI, you make it easier for fans to find and follow your music, enhancing your visibility on the platform.
What is the importance of verifying your identity on Spotify?
Verifying your identity is essential as it confirms your legitimacy as an artist, helping to build trust with your audience and ensuring you have control over your artist profile.
How do you set up a Spotify artist account?
To begin with Spotify for Artists, visit artists.spotify.com and sign up using either your artist’s Facebook account or by manually providing your email, name, and country information. This process involves verifying your identity as an artist or representative, which enables you to manage your Spotify presence effectively.
What insights can I gain from Spotify for Artists?
The platform provides valuable insights into your audience’s behavior and preferences, helping you understand your listeners better and tailor your strategies accordingly.
How can I manage my artist profile on Spotify?
Spotify for Artists allows you to update your artist profile, ensuring it reflects the latest news and updates you want to share with your fans.
What do I need to set up a Spotify Artist account?
To set up a Spotify Artist account, you’ll need a verified Facebook page for your artist or band, an active email address, and images like a headshot and cover photo. Additionally, you should provide details such as a biography, your music genres, and links to your social media profiles.
What is Spotify Canvas and how can I use it?
Spotify Canvas allows you to upload short, looping videos to your artist profile. These visuals can enhance your profile and provide fans with a taste of your live performance style.
How do I add tour dates to my Spotify profile?
You can add your upcoming tour dates directly to your Spotify profile, allowing fans to easily see when and where you’ll be performing live.
How can I enhance my Spotify profile?
Enhance your profile by uploading high-quality photos and completing your biography. Ensure all the information you provide is current and accurate to give a professional impression.
What are the benefits of managing your presence on Spotify?
Managing your presence on Spotify gives you control over your artist profile, audience engagement, and marketing strategies. It allows you to connect with fans, monitor performance, and make data-driven adjustments to enhance your music career.
How can you optimize your strategy for music marketing on Spotify?
With access to your artist dashboard, you can tailor your marketing strategies based on the insights and data provided. This allows for informed decision-making to improve promotional efforts and maximize reach.
How can you grow your music career using Spotify?
Spotify provides tools and insights that can be leveraged to enhance visibility and engagement, thus aiding in the growth of your music career. By understanding your audience and optimizing your content, you can reach more listeners and expand your fanbase.
How can you understand your audience on Spotify?
Once you have access to your artist account, you can gain insights into your audience through detailed analytics and statistics. This data helps you understand listener demographics, preferences, and engagement patterns.
What is the goal of setting up the artist profile?
The aim is to create a compelling artist profile that captures attention and stands out to fans and listeners.
What artist-related information do I need to provide?
You should be ready to provide your artist name and a brief biography to help set up your profile.
Do I need a Spotify user account to set up a Spotify for Artists account?
Yes, you need to have a Spotify user account. If you don’t have one, you can easily sign up for a free account on Spotify’s website.
What does the verification process involve?
The verification process typically requires you to confirm your identity and connect your artist profile to your music distributor.
Where do you go to start the claiming process?
Begin the process by visiting the Spotify for Artists website.
What is the initial requirement to claim a Spotify for Artists profile?
You need to have your music published on Spotify before you can claim your artist profile.
Why is keeping my profile up-to-date important?
Regularly updating your profile ensures it remains appealing and professional, which helps in attracting new listeners and maintaining the interest of existing fans.
Why is it important to use high-quality images?
High-quality images enhance the professional appearance of your page, making it more attractive and inviting to potential listeners.
How should I craft my bio for my artist page?
Ensure your bio is not only engaging but also informative, offering intriguing insights about yourself and your music to captivate your audience.
What specific elements can I customize on my Spotify artist page?
You can personalize your Spotify artist page by adding a captivating bio, updating your profile picture, and highlighting your most recent releases to engage listeners.
What career opportunities does Spotify’s global reach provide to artists?
The extensive global reach of Spotify offers artists unique opportunities to advance their careers by tapping into international markets and audiences.
How do Spotify’s algorithms benefit artists?
Spotify’s algorithms play a crucial role in connecting artists with new listeners who may enjoy their music, thus enhancing their chances of success by expanding their listener base.
How can Spotify help an artist gain international recognition?
By enabling artists to reach a global audience, Spotify increases the likelihood of artists gaining international recognition and growing their fan base across diverse regions.
How do playlists connect you with a broader audience?
Playlists serve as a strategic tool for music promotion, allowing you to connect with a wider audience on platforms like Spotify by tapping into existing listener bases and broadening your reach.
Why is sharing playlists important for visibility?
Sharing playlists boosts your visibility by featuring your music alongside tracks from other admired artists, making it easier to attract new listeners who are exploring similar sounds.
How does updating your bio help your audience?
Keeping your bio current ensures that your fans are always informed about your latest projects and releases, which helps maintain their engagement and interest in your work.